
Recovery Zone — indicative recovery context from training logs
What an internal model score from working sets, volume and elapsed time does and does not say.
Workout data as a basis
Wearables can record general signals such as HRV and sleep duration. Instead, Recovery Zone uses only the training context available within Vytrix.
Recovery Zone is an internal model score of logged volume, number of working sets, and elapsed time. The model does not measure biological recovery and does not determine whether training is medically safe.
The model
For each muscle group, Vytrix processes logged work sets, total volume and time since last load into an 0–100 indicator. The fixed time categories and normalization are Vytrix choices, not a clinically validated instrument.
Muscle protein synthesis research provides biological context for recovery after strength training, but does not validate individual readiness scores or personalized training advice.
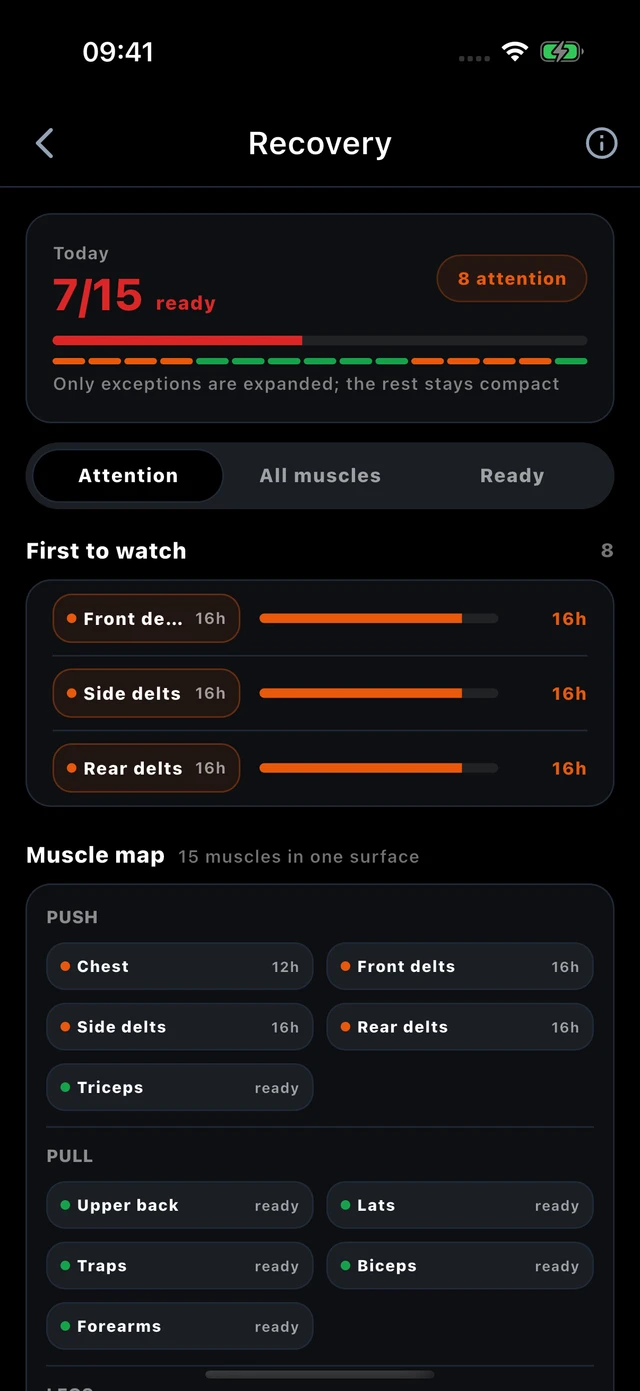
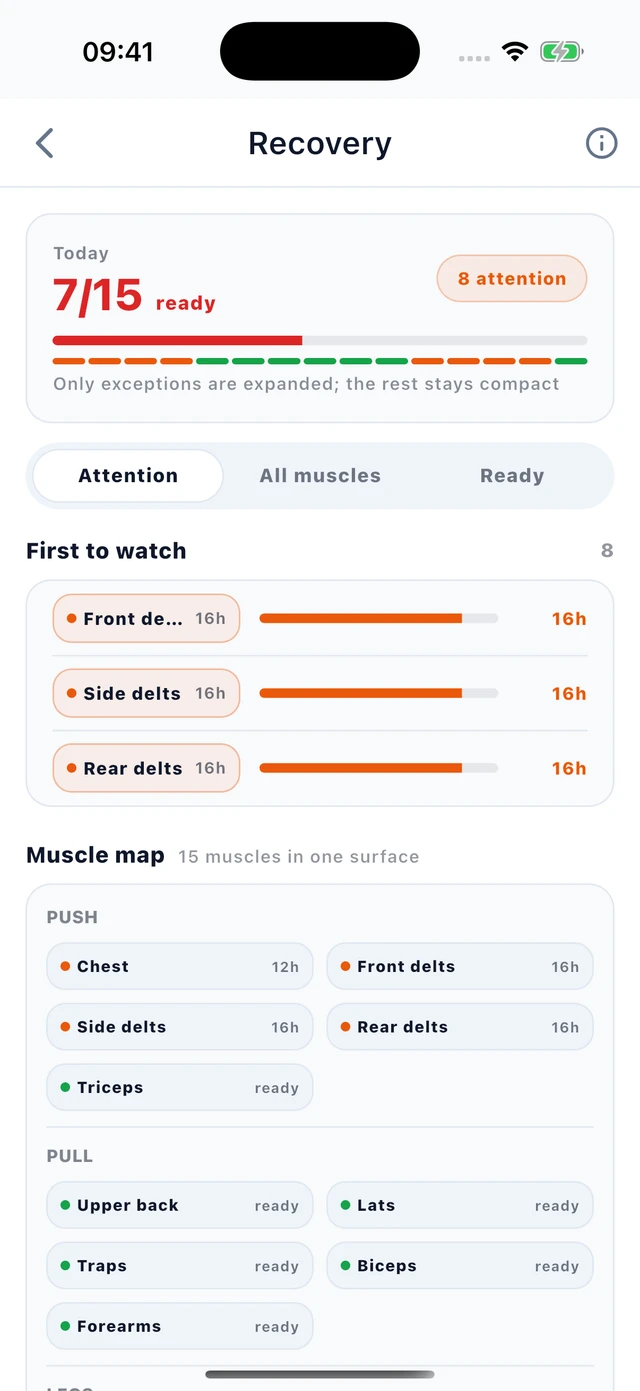
Recovery context per muscle group
The app groups the muscles and shows where recent strain has been logged. This is a model estimate; the colors do not measure biological recovery.
Real app image · example dataSleep as a separate context
Sleep can be relevant to how someone feels and performs, but is not a fixed input to the primary Recovery Zone calculation. Where sleep data is available, Vytrix shows it as additional context.
Always consider how you feel and consult a qualified professional if you have any pain or health questions.
Sources
- Damas, F. et al. (2016) — A review of resistance training-induced changes in skeletal muscle protein synthesis. Sports Med
- Schoenfeld, B. J. et al. (2017) — Effects of resistance training frequency on measures of muscle hypertrophy: a systematic review and meta-analysis. J Sports Sci
- Dattilo, M. et al. (2011) — Sleep and muscle recovery: endocrinological and molecular basis for a new and promising hypothesis. Med Hypotheses
No external expert review has yet been published for this page. Learn how we create our content. Do you see an error or are you missing a source? corrections@vytrix.app
Indicative recovery time per muscle group (hours up to MPS resolution)
Muscle Protein Synthesis remains elevated 24–72h after training, depending on volume and training experience. Vytrix Recovery Zone uses exponential decay within this range — high-volume sessions decay more slowly.