
Adaptive TDEE with periodic recalculation
An energy estimate that combines logged intake and weight trend.
The problem with static TDEE
The classic TDEE calculation (BMR × activity multiplier) is a starting point — not a fixed truth. Everyone has a different activity level, and metabolic adaptation causes energy output drift during cuts (Trexler et al. 2014).
With sufficiently complete data, Vytrix estimates energy use from average logged intake and change in a smoothed weight trend. The outcome remains an estimate and is not an automatic guarantee of a specific result.
How it works
Vytrix estimates energy use from average logged intake and the change in a smoothed weight trend. In the start-up period, this outcome is combined with a formula estimate; the weighting increases as more data is available.
The chosen boundaries, blend and energy densities are Vytrix implementation choices, not a clinically validated protocol. Short-term changes in fluid and glycogen can noticeably affect the outcome.
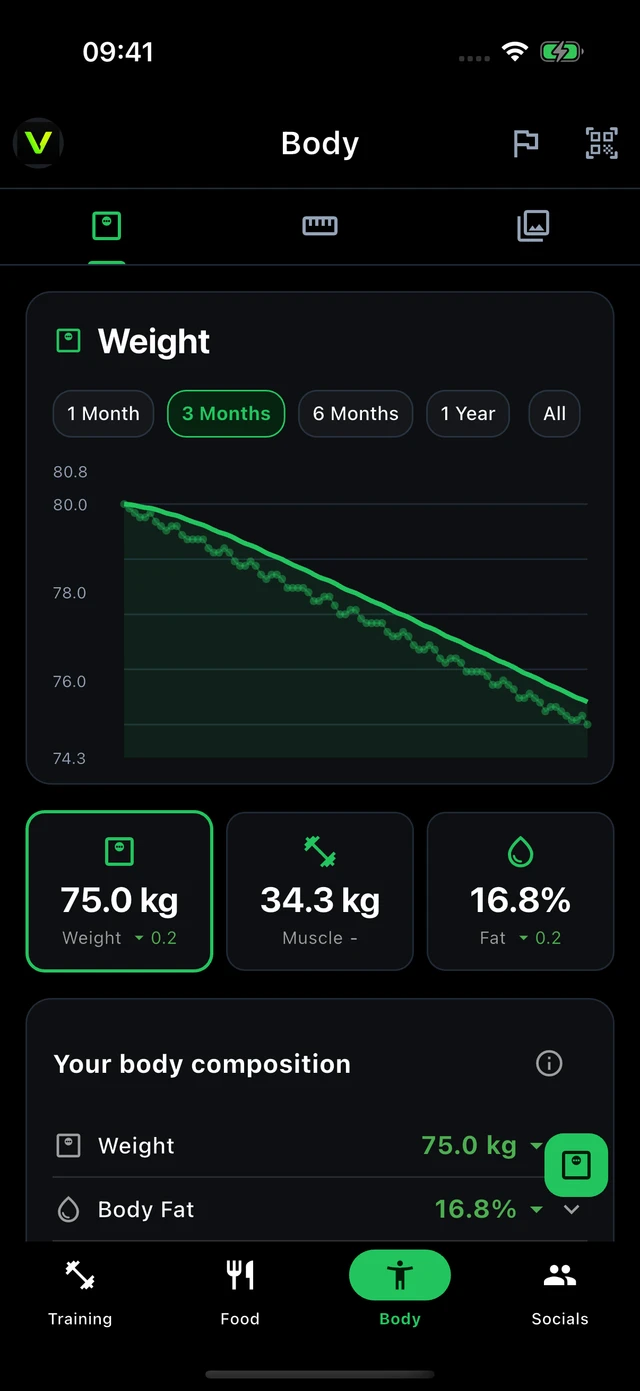
Look at your trend over time
This weight overview shows how the app displays measurements over several weeks. Together with your nutrition logs, this gives context to an energy estimate.
Real app image · example dataTrexler curve and metabolic adaptation
During weight loss, energy expenditure may change; the extent varies per person and context. Vytrix uses logs to periodically update its energy estimate, but this does not guarantee a specific waste outcome.
Sources
- Trexler, E. T., Smith-Ryan, A. E., Norton, L. E. (2014) — Metabolic adaptation to weight loss: implications for the athlete. J Int Soc Sports Nutr
- Müller, M. J. et al. (2015) — Metabolic adaptation to caloric restriction. Obesity Reviews
- Mifflin, M. D. et al. (1990) — A new predictive equation for resting energy expenditure in healthy individuals. Am J Clin Nutr
- Hall, K. D. (2008) — What is the required energy deficit per unit weight loss? Int J Obes
No external expert review has yet been published for this page. Learn how we create our content. Do you see an error or are you missing a source? corrections@vytrix.app
TDEE-drift during a 12-week cut (illustrative)
A static BMR×activity number remains 2700 kcal. The actual energy output (rolling measurement from kcal intake and weight progression) gradually drops to ~2350 kcal — approximately 13% metabolic adaptation, well within the 5–15% range reported by Trexler et al. (2014).