
How Vytrix calculates Strength Score
A personal strength score from your working sets, body-size basis and available references — on an open points scale, with attention to its limits.
What the strength score shows
The personal strength score is Vytrix’s own indicator on an open points scale. With enough suitable exercises, muscle-group and total scores can exceed 100. Above 100, the points band is called World Class; this is a product name, not a proven competition level or population percentile. You can also see how many muscle groups have enough data.
Mainly use the score to understand your own training history. The number is not a measured percentage of your strength potential and is not a medical assessment.
From a working set to a score
The app estimates a maximum weight for one repetition (e1RM) from appropriate work sets. Such an estimate depends on the logged load, repetitions and the formula used. You don't have to make a real maximum effort for this.
The personal overview uses suitable fat-free mass as its body-size basis. Without a usable measurement, it applies an indicative adjustment using the available height and weight data; it does not estimate body-fat percentage from BMI. The app applies available male/female references for each exercise and combines suitable exercises per muscle group. Missing standards are not filled in. Limited coverage can cap a group score.
These aggregation, thresholds and data requirements are product choices. Researching 1RM estimates does not automatically validate the complete Vytrix score.
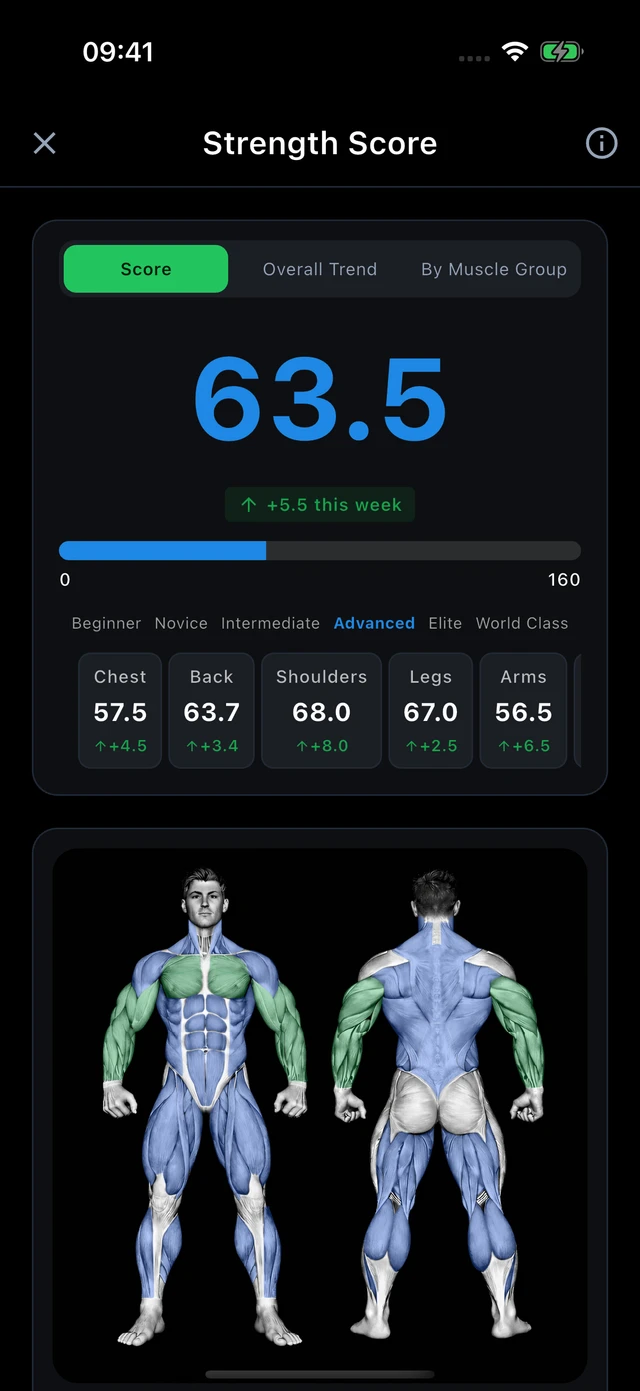
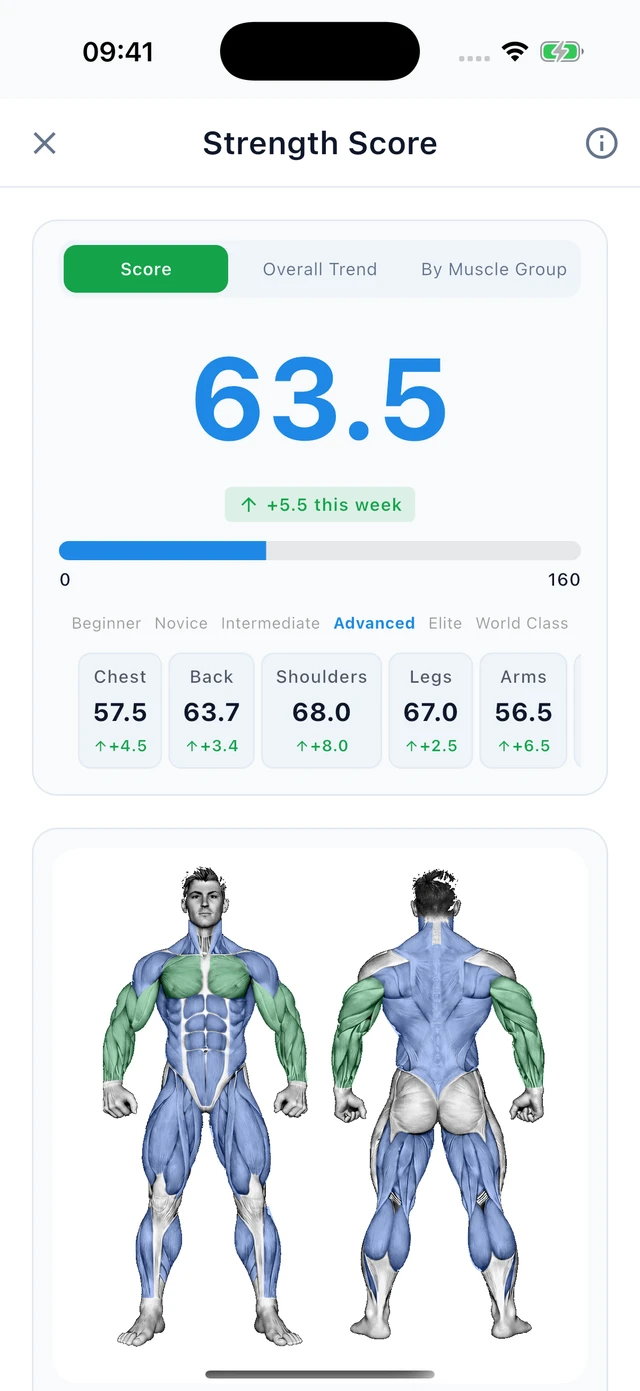
From your work sets to a strength score
In the app you can view your total and the distribution per muscle group. The score shown is a Vytrix indicator from training data.
Real app image · example dataWhy the web calculator can differ
The web calculator is a separate 0–100 calculation example with manually entered performances and general thresholds per muscle group. The personal app overview uses the open scale, your training history, body-size basis and available male/female references. The results therefore do not have to match.
The app trend recalculates earlier suitable training sets with the same current body-size basis and references. This compares training performances under the same calculation, rather than historically measured fat-free mass or the score the app showed at the time. Changes to your profile, source sets or references can change the entire line without representing strength gains alone.
Sources
- Epley, B. (1985) — Poundage chart. Boyd Epley Workout, Body Enterprises, Lincoln NE
- Reynolds, J. M. et al. (2006) — Prediction of one repetition maximum strength from multiple repetition maximum testing. J Strength Cond Res
- Brzycki, M. (1993) — Strength testing: predicting a one-rep max from reps-to-fatigue. JOPERD (alternative formula, for reference)
- StrengthLevel.com — Strength Standards (public distribution data by lift)
No external expert review has yet been published for this page. Learn how we create our content. Do you see an error or are you missing a source? corrections@vytrix.app
Level bands per muscle group (e1RM ÷ bodyweight)
General level thresholds of the web calculator. The app also applies exercise-specific normalization and data requirements; the results may differ.